
Candlestick Chart Patterns


Why do candlesticks work?
Before getting deeper into different candlestick patterns, let us understand why candlesticks work. As discussed in the previous lesson, a chart conveys information to a greater extent compared to price.
A candlestick chart allows traders to compare the behavior of price in different time periods with a quick glance at the chart.
Traders gauge the market sentiment by looking at the length of the candle, length of the wicks, etc. For example, a long white candle with no wicks signifies that bulls were on an upper hand overbears.
Candlestick patterns combined with other technical indicators have become popular among traders as reliable signals of future market behavior.
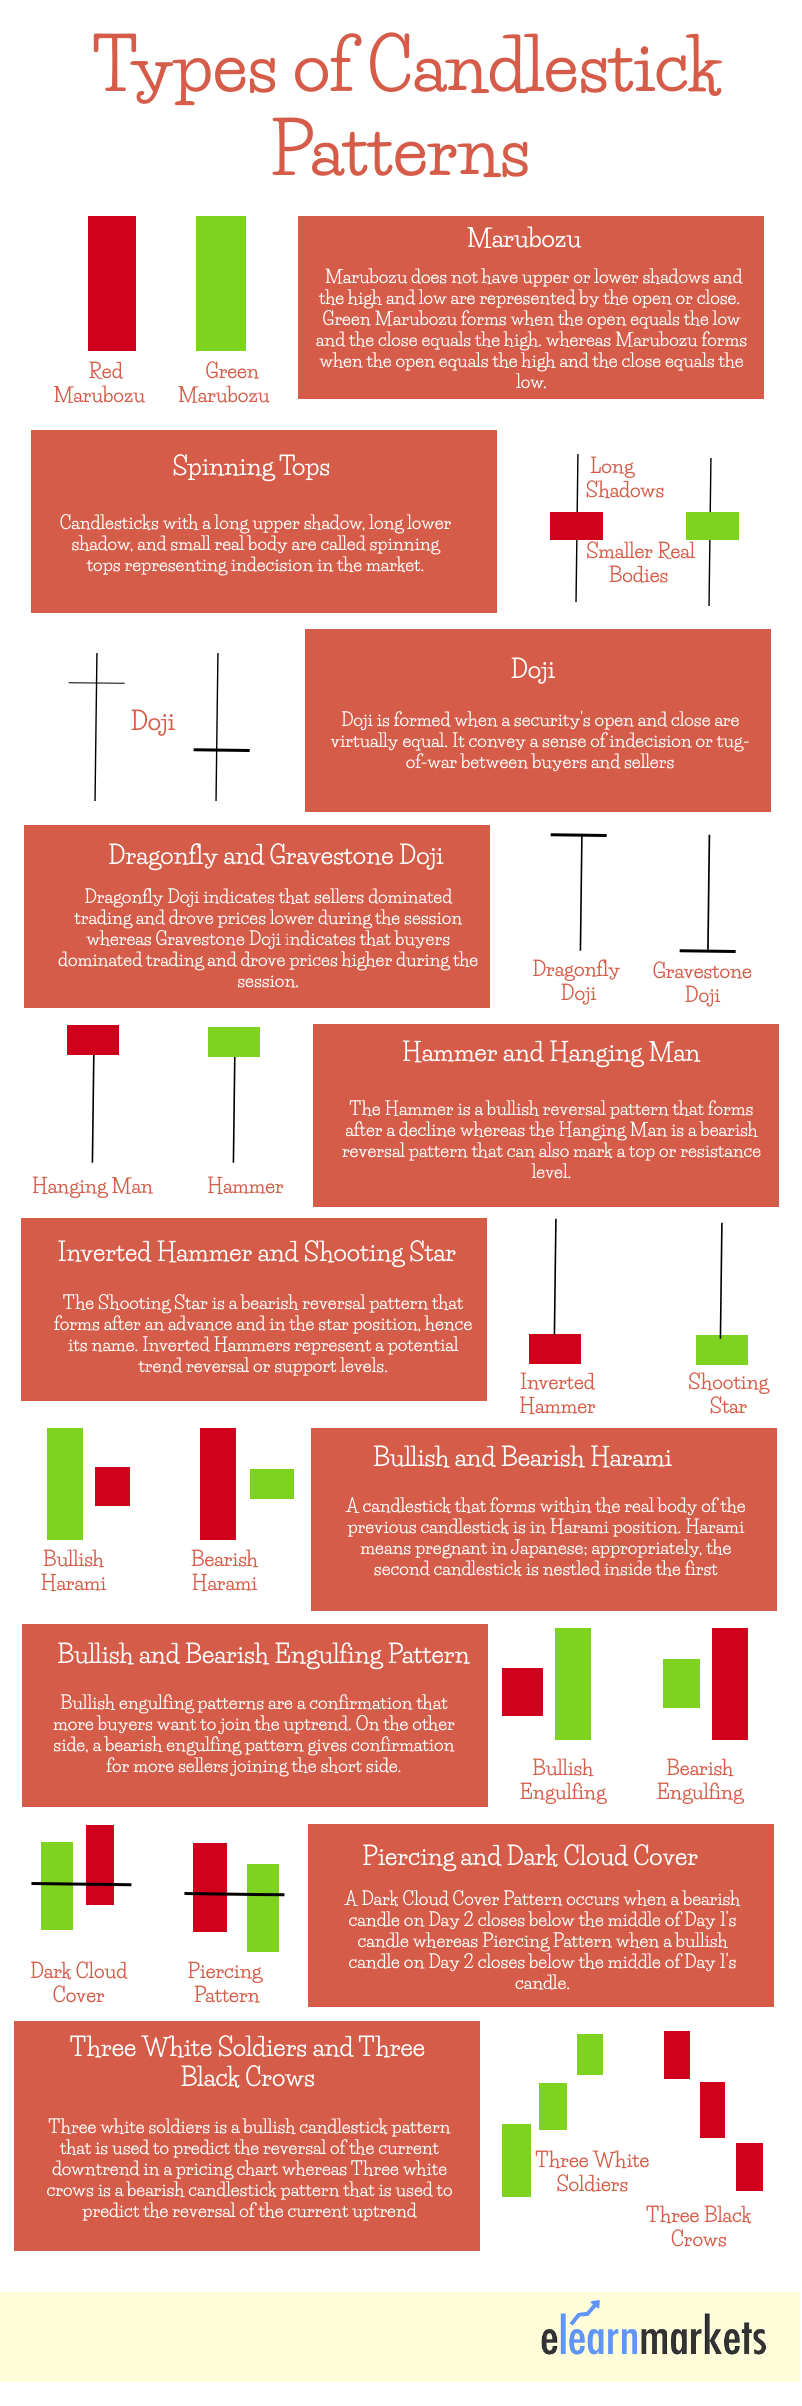
Types of Candle Sticks:
Single Candle Patterns:
Doji: when the open price is equal / near equal to its close price, it is termed as a Doji. In other words, it can be said that when there is a zero/near-zero range between the open and close price is termed as a Doji. Doji candle suggests indecision or balance between the two forces i.e. Bullish and Bearish.
In another context, when there is a strong trend in any direction and a Doji is observed, it can be seen that the strength of the trend is weakening.

Normal Candle

Perfect Doji (Traditional)

Near Doji
Above is a glimpse of comparison between the appearances of a Doji V/s Normal Candle
Different Types of Doji:
Gravestone Doji: This is partly a bearish pattern. Open, Close and Low prices of the candle are the same. Gravestone Doji implies that buyers and sellers were in a tough fight, and by the end of the session; Sellers were able to push the prices to its open price.

Condition: open=low=close
Dragonfly Doji: This is partly a bullish pattern. Open, Close and High prices of the candle are the same. Dragonfly Doji implies that buyers and sellers were in a tough fight, and by the end of the session; Buyers were able to push the prices to its open price.

Condition: open=high=close
Long-Legged: Long Legged Doji is similar to traditional Doji in a way that both indicate indecisiveness in price movement. After the Traditional or Long-Legged Dojis are observed in the chart, price tends to move in sideways for some time.

Hammer:
A Hammer is a candlestick pattern with a long wick below the candle’s body and a little to no wick above the candle’s body. The length of the body is usually 1/3rd of the length of the lower wick.

A little or no wick above the candle’s body signifies that there was a huge selling pressure from starting of the day and it continued throughout the day.
A long wick below the candle’s body and smaller candle’s body signifies that bulls were able to push the prices higher by the end of the day.
A hammer pattern is usually observed at the end of a downtrend implying an unsuccessful effort by bears to push the price down, and a corresponding effort by bulls to step in and push the price back up quickly before the period closed.
Confirmation of Uptrend: When the next candle breaks the high of the hammer, an uptrend is confirmed.
Hanging Man:
Hanging man is identical in shape to the hammer but the difference is that while hammers occur in a downtrend, the hanging man pattern occurs in an uptrend.

In a Hanging man, the price opens and makes a low during the day. But by the end of the session, bulls step in and push the prices up.
In a Hanging Man, the wick extends down and signifies the starting of a bearish trend capable of pushing the price down. It gives the first sign that the uptrend is exhausting, and the trend could reverse from here.
Confirmation of Downtrend: A Downtrend can be confirmed when the consequent bearish bar breaks the opening price of the bullish bar on the other side of the hanging man.
Shooting Star:
Shooting Star is simply an inversion of the hanging man pattern. It has a small body and a long wick above it, with little to no wick below. A shooting star is usually observed in an uptrend and signifies trend exhaustion. Price opens at a higher level and goes to a new high during the session, but by the end of the day closes below the open. The long wick above the body of the candle implies that bulls tried to push the price up but ultimately the bears won.

Confirmation of Down Trend: In the case of a Shooting Star, opening the price of the previous candle to shooting star acts as a neckline. Once a bearish candle crosses the neckline, a downtrend is confirmed.
Inverted Hammer: An Inverted Hammer is usually observed at the end of a downtrend. It has a long wick above the candle’s body and a little to no wick below the candle’s body. The length of the body is usually 1/3rd of the length of the upper wick. This pattern is similar to Shooting Star and differs only in the position where it occurs.

Marubozu: A Marubozu candlestick pattern I loved by many traders since it indicates a strong movement. This pattern does not have any wicks on either side of the candle’s body. There are two kinds of Marubozu patterns termed as Bullish Marubozu and Bearish Marubozu.


As seen in the above diagrams, price opened and traded in a particular direction throughout the day indicating bulls/bears are in full swing.
Two Candle Patterns:
Engulfing Pattern:
An engulfing pattern consists of two candlesticks where one candle engulfs the body of the previous candle. There are two types of engulfing patterns
- Bullish Engulfing
- Bearish Engulfing
Bullish Engulfing:

A Bullish Engulfing pattern is generally observed at the end of a downtrend. On the first day, the price opens lower than the previous day and closes further lower. The next day, the price opens lower and tries to do the same but bulls step in and the price closes above the previous day’s open making it a bullish engulfing pattern.
Bearish Engulfing:

A Bearish Engulfing pattern is generally observed at the end of an uptrend. On the first day, the price opens higher than the previous day and closes further higher. The next day, the price opens higher and tries to do the same but bears step in and the price closes below the previous day’s open making it a bearish engulfing pattern.
Piercing Pattern:

A Piercing pattern is similar to the bullish engulfing pattern in a way that both of them appear near the end of a downtrend.
As seen in the above figure, the 2nd candle opens lower and closes halfway through the 1st candle. Price action in a piercing pattern is very similar to the bullish engulfing pattern. Price opens lower on the 2nd day and manages to close just below the open price of the previous candle. Rule of thumb for the piercing pattern is that the 2nd candle engulfs 50% – 100% of the 1st candle.
Dark Cloud Cover:

A Dark Cloud Cover pattern is similar to the bearish engulfing pattern in a way that both of them appear near the end of an uptrend.
As seen in the above figure, the 2nd candle opens higher and closes halfway through the 1st candle. Price action in a dark cloud pattern is very similar to the bearish engulfing pattern. Price opens higher on the 2nd day and manages to close just above the open price of the previous candle. Rule of thumb for dark cloud pattern is that the 2nd candle engulfs 50% – 100% of 1st candle.
Harami Pattern:
The word “Harami” in Japanese means a pregnant lady. A Harami pattern is quite opposite to an engulfing pattern. In an engulfing pattern, the 2nd candle’s body is larger compared to the 1st candle’s body. In a Harami pattern, the 2nd candle’s body is very small compared to the 1st candle’s body.
There are two kinds of Harami Pattern: Bullish Harami and Bearish Harami
Bullish Harami:

In a Bullish Harami, 1st candle is a bear candle and the 2nd candle is a bull candle. The 1st candle closes lower showing the strength of the bears. The next day, all of a sudden the bulls jump in and the price opens gap up and by the end of the day manages to close in a positive note.
Bearish Harami:

In a Bearish Harami, 1st candle is a bull candle and the 2nd candle is a bear candle. The 1st candle closes higher showing the strength of the bulls. The next day, all of a sudden the bears jump in and the price opens gap down and by the end of the day manages to close in a negative note.
Three Candle Patterns:
Morning Star: This pattern is observed at the end of a downtrend. Morning Star pattern has 3 candles with gaps in between each candle. These gaps in between the candles signify the strength between bulls and bears.

Markets are in a strong downtrend and even on day 1 of the pattern, the bearishness continues and price makes a new low.
On the 2nd day of the pattern, price opens the gap down and closes as a Doji. This Doji signifies the indecision in the market and also signifies that bears are losing their strength.
On the 3rd day of the pattern, price opens gap up showing the strength of the bulls and continue to dominate throughout the day. By the end of the day, the price manages to close above the opening of day 1’s open price.
Evening Star: This pattern is observed at the end of an uptrend. Markets are in a strong uptrend and even on day 1 of the pattern, the bullishness continues and price makes a new high.

On the 2nd day of the pattern, price opens gap up and closes as a Doji. This Doji signifies the indecision in the market and also signifies that bulls are losing their strength.
On the 3rd day of the pattern, price opens gap down showing the strength of the bears and continue to dominate throughout the day. By the end of the day, the price manages to close below the opening of day 1’s open price.
Interpreting Patterns on Candlesticks Charts:
As candlesticks are more appealing, the trader looks for candlestick patterns which can be continuation or reversal.
These candlestick patterns can also be classified into bearish and bullish candlestick patterns.
The candlestick patterns can be a single candlestick pattern or may be formed by grouping two-three candlesticks.
Register Olymp Trade & Get Free $10,000Get $10,000 free for newbies
Some of the examples of such candlestick patterns are:
Example of a single candlestick pattern:
- Marubozu
Doji
Spinning Tops
- Hammer
- Inverted Hammer
- Hanging man
- Shooting star
Multiple candlestick patterns are formed by multiple candles.
Example of multiple candlestick patterns:
Engulfing pattern
o Bullish Engulfing
o Bearish Engulfing
- Harami
o Bullish Harami
o Bearish Harami
Piercing Pattern
Dark cloud cover
Morning Star
Evening Star
Three Assumptions while analyzing the Candlesticks Charts :
1. One should buy strength and sell weakness:
Strength is usually represented by a bullish (green) candle whereas weakness is represented by a bearish (red) candle.
One should usually buy on a green candle day and sell on a red candle day.
2. One should be flexible with patterns:
There could be minor variations to the pattern because of market conditions.
Therefore, one should be a bit flexible when analyzing these candlestick patterns on the charts.
3. One should look for a prior trend:
The prior trend should be bearish when looking for a bullish candlestick pattern and similarly, the prior trend should be bullish if you are looking for a bearish pattern.
Key Takeaways:
Candlestick charts are a type of technical charts that analyses further price movement similar to the bar charts or line charts.
Each candlestick is mainly made up of real bodies and wicks also known as shadows or tails.
The opening price of the asset > closing price = Open will be at the top of the candlestick body.
The closing price of the asset > opening price = Close will be at the top of the candlestick body.
As candlesticks are more appealing, the trader looks for candlestick patterns which can be continuation or reversal patterns.

0 Comments